Customizing the Dashboard
Customize your instance's appearance and your personal dashboard
Server settings control the appearance of your instance for everyone. Your account settings control your own dashboard.
Server settings
Open Server Settings → Website for the options below, and save after making changes. The favicon is configured separately through the filesystem.
Favicon
Replace public/favicon.ico with your icon. This appears in browser tabs and bookmarks. In Docker, mount your replacement file at /zipline/public/favicon.ico.

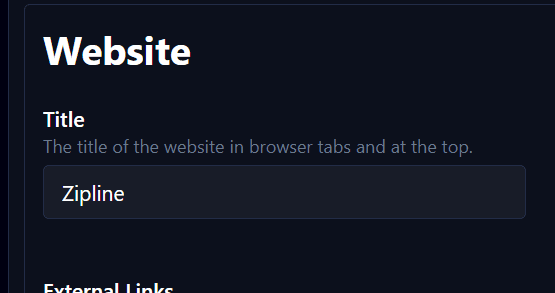
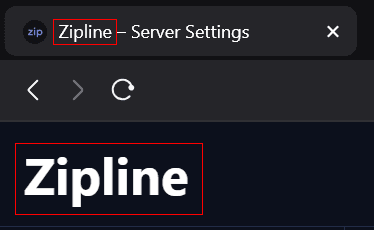
Title
Set Title to the name you want in the browser tab and navigation bar.
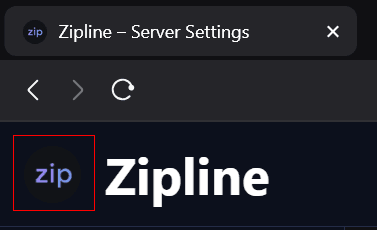
Title logo
Set Title Logo to an image URL to change the logo in the navigation bar.
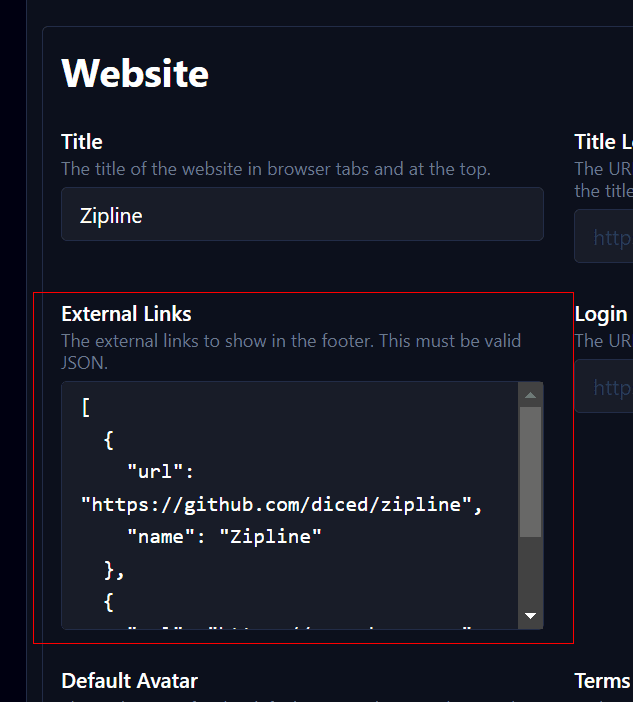
External links
External Links adds links at the bottom of the sidebar. Enter a JSON array whose objects contain name and url fields, or use the External Links Builder to generate it.
Terms of Service
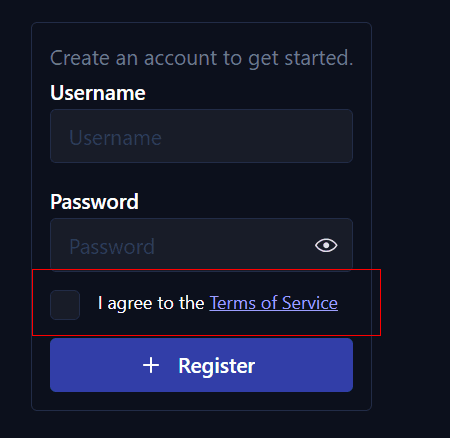
Set Terms of Service to the server-side path of a Markdown file. Zipline serves it at /auth/tos and asks new users to agree to it when registering.
In Docker, mount the file into the container:
services:
  zipline:
    volumes:
      - ./tos.md:/zipline/tos.md:ro
Then enter /zipline/tos.md in the setting. Keep your service's other configuration and volumes when adding this mount.
Login background
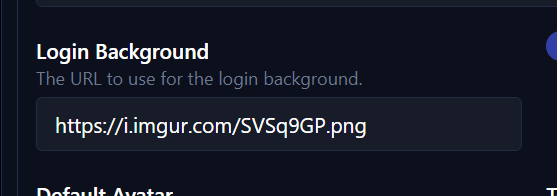
Set Login Background to an image URL. Enable Login Background Blur if you want to blur it.
Default theme
Choose the default theme for users who haven't selected their own, including visitors viewing public file pages.
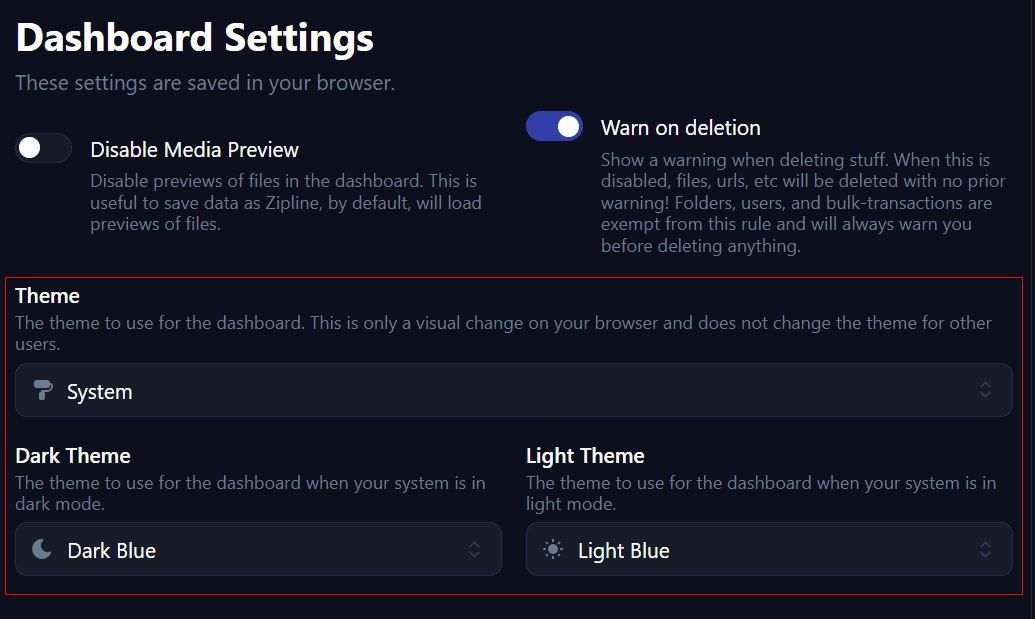
Selecting System exposes separate light and dark theme choices, used according to the visitor's browser or operating system preference.
To create a theme, follow the Themes guide. You can also contribute a theme through a pull request.
Personal dashboard settings
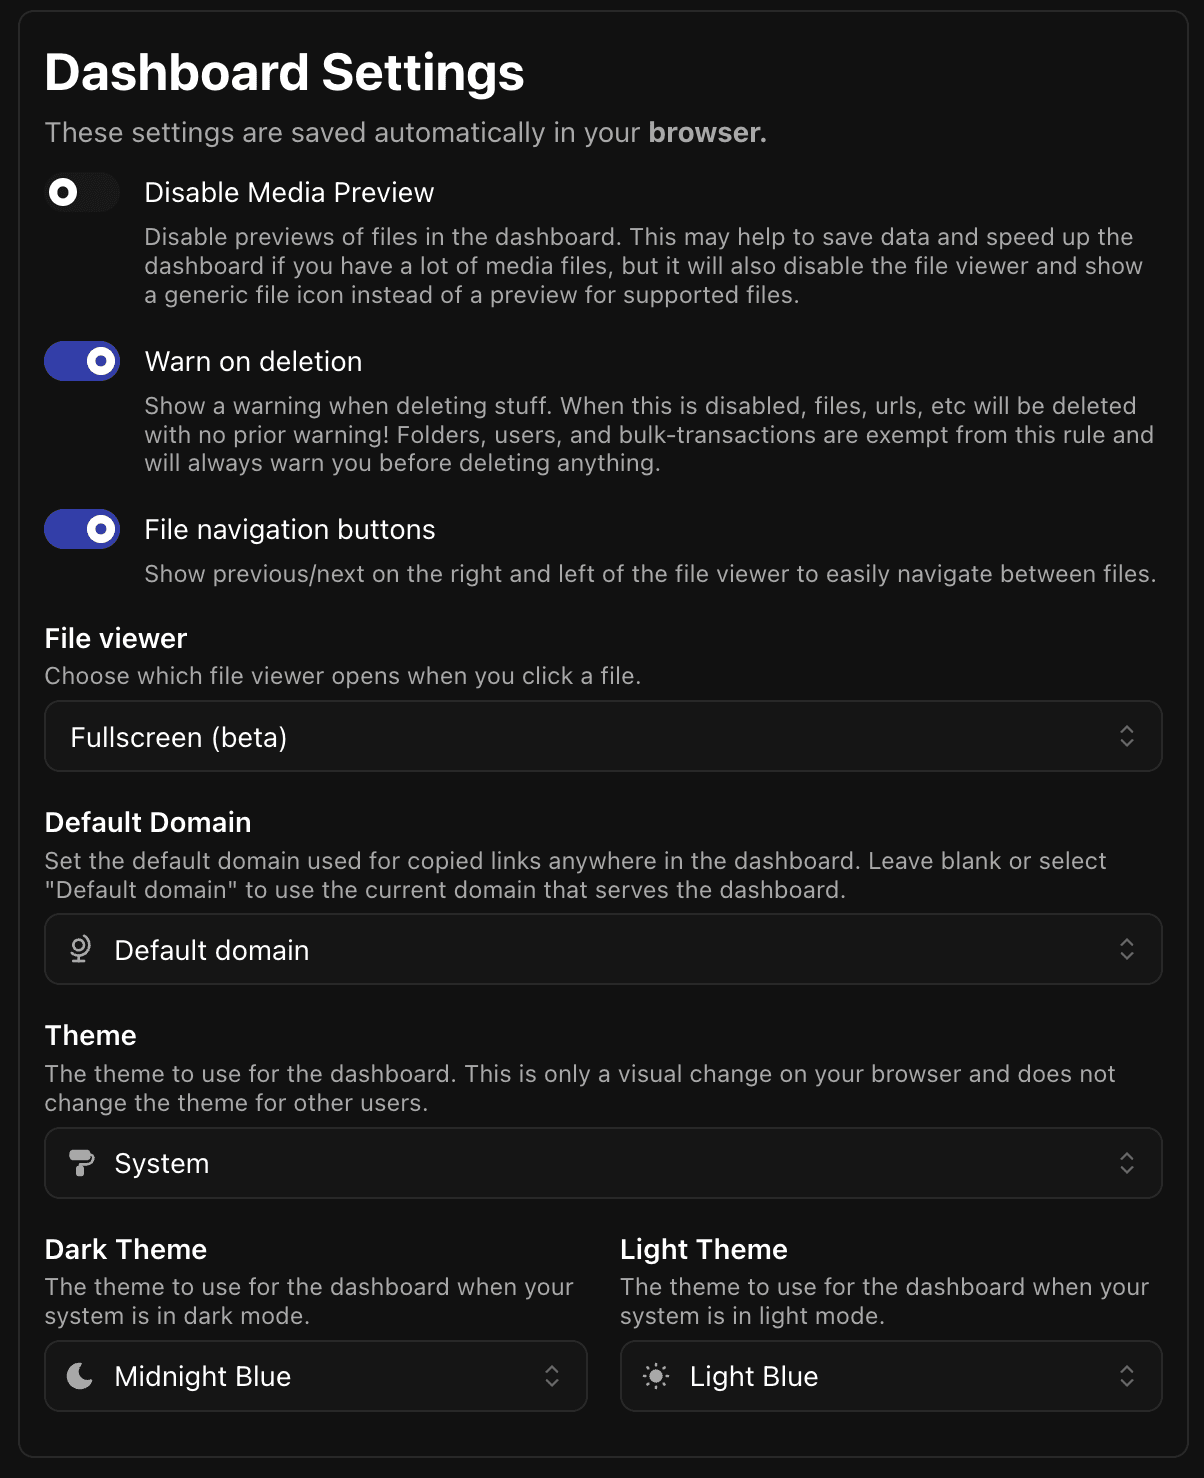
Open your account settings from your avatar in the top-right corner, then find Dashboard Settings.
File viewer
Choose how files open from the dashboard:
- Fullscreen fills the viewport.
- Modal opens the file in a dialog.
Default domain
Choose the domain used when copying file URLs and other links. If the server has configured domains, select one from the list; otherwise, enter your own.
Home page sections
Choose which sections appear on your dashboard home page:
- Show recents: Your three most recent uploads.
- Show activity: Daily uploads and logins over 1, 7, 14, or 30 days.
- Show file types: Your uploads grouped by MIME type.
All three are enabled by default.
Quick links
Quick links add shortcut buttons to the top of your dashboard home page.
- Find Quick links in your account settings.
- Check the pages you want shortcuts for.
- Drag the entries into your preferred order.
- Click Save.
To remove all shortcuts, uncheck every entry and save. Your selection and order are saved to your account across browsers and devices.
Available links depend on your role and the server's enabled features. Administrator pages are only offered to administrators; metrics appear only when your account can access them.